Author Archives: Amanda Wiggins
June 10, 2019 6:20 pm
Comments Off on Takeaways from the Caribbean Hotel Investment Conference – by Allison Fogarty The Caribbean is open for business, although recovery continues. As the region continues to recover from the devastating 2017 storm season, many hotels have reopened, even as infrastructure work continues. As always, recovery takes longer than anticipated, but open insurance claims are settling, and a number of properties are slated to reopen later this year, in time for the 2020 high season. Following the devastation, many owners of heavily damaged properties have taken the opportunity to significantly upgrade their properties with the proceeds of their insurance settlements, which will enhance their future positioning.
High Season 2019 – Strong Performance: Throughout the region, hotels demonstrated resilience and recovery according to operating results reported by Emile Gourieux of STR. For the first quarter of 2019 – high season—RevPAR increased by a whopping 10.3%, fueled by an increase of 9.0% in ADR to $267 and occupancy of 72.8%. Demand growth of 3.3% more than balanced supply growth of 2.1%. However the Caribbean is not homogenous; and the RevPAR growth was not shared equally across the region: The big winners were The Bahamas which lead in RevPAR growth, mainly due to an almost 25% increase in Occupancy and, Jamaica which achieved a 20% RevPAR growth due to a balance of occupancy and rate increases. In absolute terms, The Cayman Islands led the region in RevPAR topping $490, with a bank-breaking high season ADR of $614; Aruba achieved honorable mention with a RevPAR of just over $350 for Q1.
Construction Pipeline is soaring: The threat of hurricanes notwithstanding, the regional construction pipeline is booming, with 27,324 rooms in the pipeline, with about half under construction., STR notes a historical attrition rate of about 40% for projects in the planning stage. The Dominican Republic leads the region in hotel construction activity with over 6200 rooms (8.6% of the existing supply) under construction, following an increase of almost 4,400 rooms last year. Despite a concern that the economic cycle is moving toward its peak, interest in the Caribbean remains strong.
Lessons Learned: Those deploying capital in the region are paying closer attention to insurance coverage and policies, and generally demonstrate a preference for issuing senior debt for existing cash flowing assets, according to KPMG. Lenders and brands have adopted a more disciplined approach to new development; hotel projects must generally make sense on a standalone basis aside from other components.
All-inclusive resorts are booming – the all-inclusive concept has grown across the quality spectrum, and traditional EP brands have moved into the segment, even as the traditional all-inclusive resort operators focus on developing their own distribution channels and brands in an effort to keep more revenue in-house. Conversion opportunities are still available to acquire and redevelop well-located older properties, although older EP properties require significant investment in additional restaurants, recreation and entertainment facilities.
About Pinnacle Advisory Group
Since 1991, Pinnacle Advisory Group has provided advice and analysis on the full spectrum of hospitality properties throughout the US and Caribbean: hotels, resorts, conference centers, mixed use projects, convention centers and exhibition centers. Pinnacle’s services include development counseling, appraisals, acquisition due diligence, asset management and litigation support. Our clients include leading hotel companies, REITs, universities, major banks, and municipalities. We specialize in providing personalized advice on complex projects, carefully tailoring our services to each client’s individualized needs.
April 16, 2019 7:17 pm
Comments Off on MCCA Annual State of Hospitality, April 2019 – by Sebastian Colella The Massachusetts Convention Center Authority hosted its annual event in April focusing on the Authority’s economic impact on Boston’s hotels and restaurants. This year’s data driven, panel discussion focused on how the impact of citywide events drives compression in hotel rates, increases restaurant activity, and generates feedback on Boston as a destination from event owners and attendees. Sebastian Colella represented Pinnacle Advisory Group as a panelist along with others from the MCCA, UberMedia and CHMWarnick.
View the presentation deck by clicking on the link below:
State of the City 4.3.19 – Distribution Deck
6:55 pm
Comments Off on Greater Boston Hotel General Manager Meeting, March 2019 – Sebastian Colella Sebastian Colella provided an updated Outlook to General Managers and Sales Managers representing a variety of hotels in Greater Boston. The presentation provided local leaders in hospitality insight on the market’s projected performance in 2019 and key considerations moving forward into the year.
To review the presentation, click on the link below:
Outlook Boston Update 3’29’19
6:25 pm
Comments Off on Ready, Set, Go! Boston Lodging Market Eagerly Awaits Another Marathon Weekend – by Sebastian Colella One of Boston’s long-standing traditions, the Boston Marathon, will take place the third week of April this year drawing around 30,000 registered runners, both amateur and professional, and over 500,000 spectators made up of vendors, volunteers, staff, and media from all over the world. Hosted by the Boston Athletic Association (B.A.A.), it is the world’s oldest annual marathon and takes place every Patriots Day, a State Holiday in Massachusetts. The Boston and Cambridge lodging market thrives during the weekend surrounding the Boston Marathon and this year, the 123rd annual, will be no different.
Over time, the Boston Marathon has grown into a four-day event comprised of the John Hancock Sports & Fitness Expo (being held at the Hynes Convention Center this year), a 5k race and a one-mile invitational race, along with many other events held throughout the city for the world’s top marathoners, elite athletes, fitness enthusiasts, and the general public. Additionally, the Boston Red Sox have an annual mid-day game every Patriots Day at Fenway Park, one block from the marathon route at Kenmore Square. These events have helped to lengthen the average stay, attract more visitors, and increase the overall economic impact throughout the region.
In 2013, two homemade bombs were detonated near the finish line on Boylston Avenue killing three people and injuring hundreds more. Soon after, the “Boston Strong” rallying cry spread throughout the country, inspiring and supporting the City as it healed from the events. The following year, the B.A.A. increased its field size by 33% to 36,000 in order to accommodate the increase in demand largely driven by the support from the prior year’s events.
Lodging demand stemming from the marathon is typically a two to four-night stay, from Friday to Tuesday. While most of the lodging demand is accommodated in Boston and Cambridge during the long weekend, there is a considerable amount of demand in the suburban areas, travelers who are either price sensitive or those seeking accommodations with ease of access to the race’s start line and area transportation.
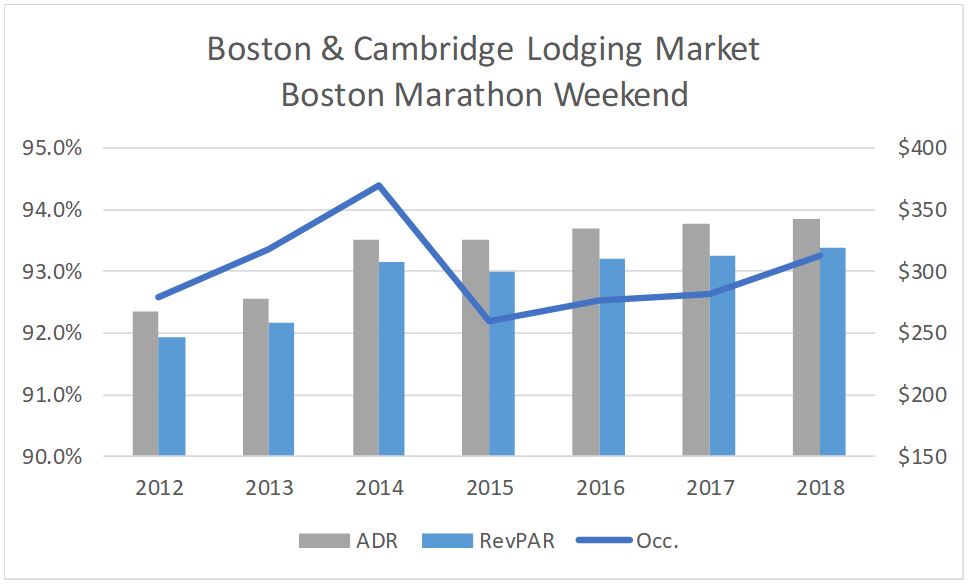
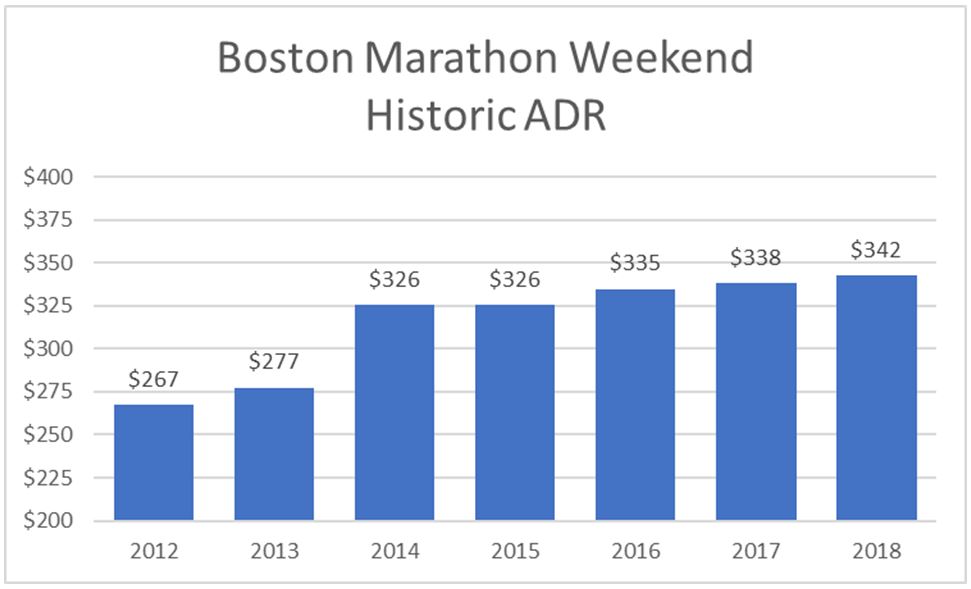
This brief analysis looks at the historic performance of the Boston & Cambridge lodging market over the three days surrounding the Boston Marathon; Saturday, Sunday and Monday nights. Over the last seven years, the market has had an average occupancy of 93% over the three-night period, ranging from 92 to 94%. Between 2012 and 2018, the ADR during these three nights has increased 4.0% on a compound annual basis with fairly significant increases from 2012 to 2014 with slow and steady growth the last four years. In 2018, the three-day weekend had a RevPAR of $319, approximately $100 above the market’s annual performance.
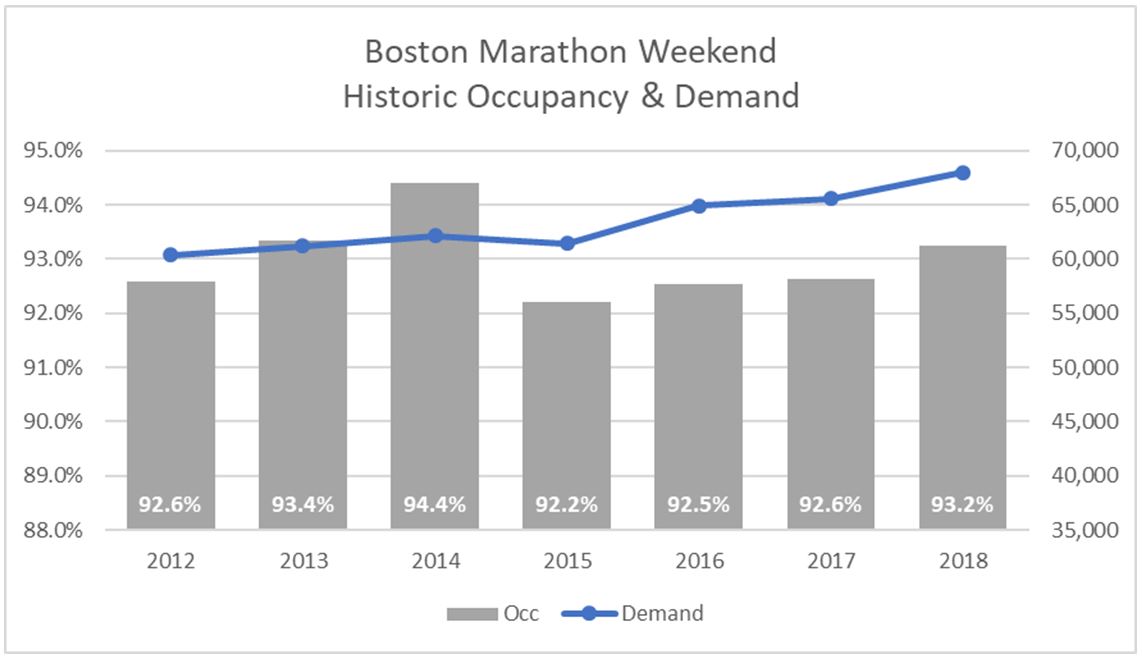
Although occupancy has remained between 92 and 94% the last seven years, demand has increased 2.0% on a compound annual basis during this period, increasing from approximately 60,400 occupied roomnights in 2012 to over 68,000 occupied rom nights in 2018. Following the tragic Boston Marathon bombing in 2013, people from near and far supported the City and those affected by the events. As a result, the Boston Marathon saw an increase in attendance, causing lodging demand to increase 1.6% over the three nights from the prior year and occupancy to reach a peak of 94.4%. Additionally, Easter Weekend overlapped with the Boston Marathon in 2014 (as with 2017) contributing to its increases in demand. With occupancies as high as they are through the weekend, the market is essentially at capacity. As such, much of the demand growth in recent years has been a result of new hotels opening in Boston allowing for those previously staying elsewhere to stay in the city.
The Boston Marathon weekend is also one of the market’s highest rated weekends of the year. The three-day average daily rate (ADR) has followed similar trends to the overall market since 2012. Increasing at above inflationary levels in 2012 and 2013 with considerable increases in 2014 as a result of its peak occupancies. Market ADR remained flat the following year as demand returned to previous levels. Since this time, ADR over the weekend has grown between 1% and 3% annually. This slower ADR growth in recent years is a result of new supply, both traditional hotel rooms and short-term rentals like AirBnB and HomeAway.
Prior to last year’s Boston Marathon, the Greater Boston Convention & Visitors Bureau projected its economic impact to the Greater Boston region to be $201 million. The Boston Marathon will continue to be a long-standing tradition for City of Boston and the surrounding area and it will always help to kick off the lodging market’s peak season.
Ready, Set, Go – SC 4’10’19
5:52 pm
Comments Off on Key Takeaways From the 2019 College and University Hotel Owners Symposium (CUHOS 2019) – Matthew Arrants Representatives of Colleges and Universities from across the country gathered at the Inn at Villanova University recently to discuss the state of the lodging industry. Participants included small liberal arts colleges like Williams College and Colby College, large Ivy League schools like Harvard, and state colleges such as the University of Virginia, Penn State, and the University of Ohio. Those that attended the symposium either owned hotels on their campus, or were interested in new hotel development. Prominent experts from management companies, including Pyramid Hotel Group, Charlestowne Hotels, Waterford Hotel Group, and Olympia offered in-depth presentations focusing on college hotels. The symposium also included a series of round table discussions where colleges and universities could learn more about deal structures and the relationship between hotels and their schools. The event was organized by Pinnacle Advisory Group, a national hotel consulting firm that specializes in both new development and asset management for college and university hotels.
Key Takeaways included the following:
Operating Structure
- The relationship between school and hotel is driven by the school’s mission/culture, financial realities, the location of the hotel relative to campus, and the trustee needs.
- The three most common operating structures are land leases, hiring third party operators, and self-operation.
- The biggest challenge for schools is balancing their desire for control with economic returns on hotel projects.
New Development and Renovations
- Construction costs are rising dramatically. This is resulting in many projects being put on hold or owners looking at renovation of existing properties as an alternative to new construction.
- Development costs for colleges and universities typically range from 20% to 40% above market rate projects. Drivers of the increased costs include the use of union labor, fair labor practices, the use of local businesses, the procurement process, and the college desire for high quality development.
- Starting early, putting together a strong team and having clear “lanes” outlined in a differentiation document for each of the team members are critical for successful projects.
Managing the Relationship Between School and Hotel
- Campus hotels face a unique and strong conflict between profit and mission. They are expected to generate profits for the school while also supporting the academic mission by providing rooms and meeting space to school users at a discount. They are also expected to support the mission through living wage and benefits policies that add costs to the operation.
- The most effective way to manage this relationship is through clear and effective communication. This includes:
- Ensuring that key decision makers understand the implications that their decisions have on profit and mission;
- Documenting in writing university expectations as it relates to mission for the operator; and
- Carefully reviewing budgets to ensure that the college understands the financial implications of mission-related decisions.
CUHOS Recap 4’11’19
March 3, 2019 3:29 pm
Comments Off on Silicon Valley Supply Growth Rates Increasing in Step with Demand Growth – by Lana Yoshii There are 80 proposed hotels and 5 expansions totaling roughly 12,000 rooms planned for development in the greater Silicon Valley area. Worse case, with 31,000 hotel rooms today, there could conceivably be a 39% increase in supply. Is it time to hit the panic button?
Since 2000, the two largest surges of new supply occurred in 2003 (4.6% growth) and 2015 (4.8% growth). However, from 2004 to 2014, Silicon Valley’s new hotel rooms supply was very mild – maxing out at a 2.3% annual growth in 2014, and averaging at a compound annual growth rate of 0.5%. In recent history, annual new supply exceeded 1,000 new rooms in 2015 and 2017. In 2018, 4 hotels (697 rooms) opened. The chart below illustrates the historical growth of hotel rooms in Silicon Valley (based on rooms available on December 31 of each year).
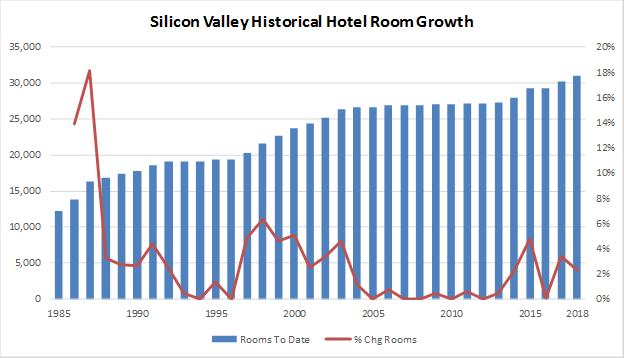
Source: STR, Pinnacle Advisory Group
The wildest ride was demand-driven: in 1985, demand grew by 15%, fell off to 13% in 1986, and then spiked again in 1987, growing by nearly 19%. The wild swings in demand were to the activity in the semi-conductor industry.
But the Silicon Valley isn’t selling chips any more, or any other tangible product. It is selling an ingredient that is critical to virtually every manufactured product, the process that produces it, or the marketing of it. The past 10 years are the most relevant.
Between 2009 and 2018, demand growth had exceeded supply growth for 8 of the 10 years. After slipping in 2016 and 2017, demand growth steamed ahead again, quite possibly because the city engineering offices can’t issue building permits in a timely manner. Regardless, RevPAR growth has not fallen below 2.2%.
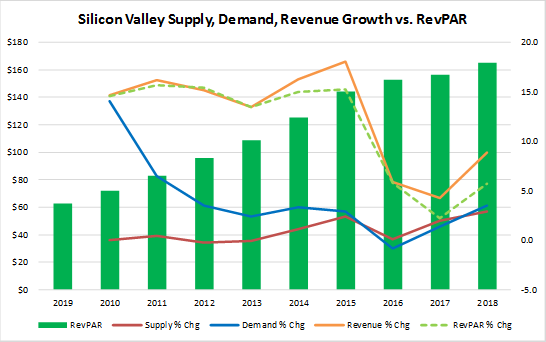
Source: STR
Silicon Valley’s employment has shown signs of maturing, but not declining. Office space continues to be absorbed at a healthy pace. Silicon Valley’s unemployment rate remains lower than the national average. The fundamentals are excellent. Recent new supply has been growing at a similar rate as demand growth, which has bled off some of the market’s ADR compression. Only a portion of the proposed hotels will get financed. Increasing construction costs are causing many of the projects to stall out. Although projected new supply may increase at a faster pace, this market is likely to remain relatively healthy for the next few years. ADRs are expected to grow moderately – at single digit rates – rather than the double digit growth rates when midweek demand met up with capacity constraints in Silicon Valley.
Details on the Current Pipeline
Of the proposed 12,000 new hotels rooms in various stages of development, there are 20 hotel projects with 3,300 rooms currently under construction. When the last of these opens over the next 2 to 2.5 years, Silicon Valley’s hotel rooms supply will have increased by a cumulative 11%.
Currently, there are approximately 3,800 rooms entitled for development. Should these entitled rooms also open, hotel rooms supply will increase by a cumulative 23%. However, with so much competing office and residential development, contractors and sub-contractors are scarce. Assuming financing were in place, the delays in pulling permits, inspections and sub-contractor scheduling inefficiencies would push the first opening dates of these rooms into 2022.
If the balance of all of the rooms under construction and entitled rooms come to fruition by the end of 2022, those 7,000 rooms would result in a 5.3% compound annual growth rate from 2018 to 2022. If all rooms under construction, entitled rooms and unentitled rooms open by 2025, these 12,000 new rooms would result in a 4.8% compound annual growth rate.
Market imbalances are a local issue. So where will these 12,000 rooms be located? San Jose leads the pack with 32% of the proposed hotel rooms in all phases of Silicon Valley development (e.g., under construction, final planning, preliminary planning, speculative). Sunnyvale follows with 23%, then Mountain View and Milpitas with 9% each. The following chart illustrates the distribution of Silicon Valley rooms in all phases of development.
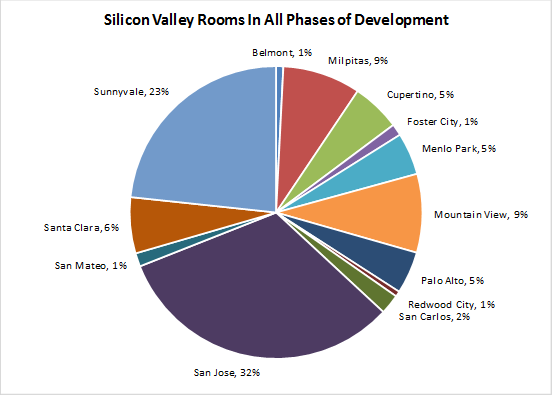
Source: STR, Pinnacle Advisory Group
Although there are numerous projects that have yet to be affiliated with a brand, the vast majority of rooms in the pipeline are in the STR-defined Upscale Chain, which includes brands such as Courtyard, Hilton Garden Inn, Hyatt House, Residence Inn, Cambria, Hyatt Place, Homewood Suites and AC Hotels by Marriott. At this time, any luxury-positioned hotels in development are slated to be independent hotels, or have not yet obtained franchise approval.
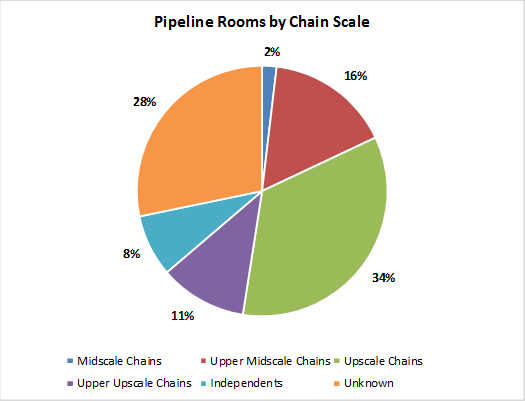
Source: STR, Pinnacle Advisory Group
The process of getting entitlements and financing can result in proposed projects never coming to fruition. Therefore, we identified the 20 projects current under construction, by city. San Jose has the most rooms under construction (33%), followed by Mountain View (20%) and Sunnyvale (19%). Interestingly, Santa Clara has 6% of the rooms in all phases of development, but 12% of the rooms currently under construction.
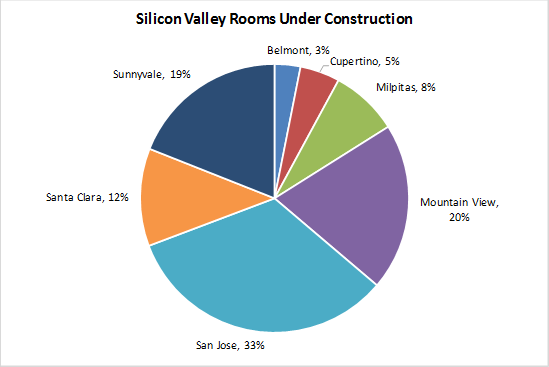
Source: STR, Pinnacle Advisory Group
We also confirmed that 26 of the planned projects (new hotels and room additions) totaling 3,779 rooms have obtained entitlements; however, may not have secured financing. The largest blocks of entitled rooms are in San Jose with 1,136 entitled rooms (30%), Sunnyvale with 1,023 entitled rooms (27%), and Mountain View with 423 entitled rooms (11%).
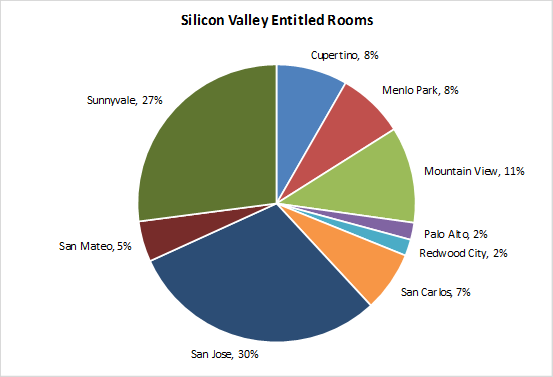
Source: STR, Pinnacle Advisory Group
The entire article can be read by clicking on the link below:
Silicon Valley Supply Growth 2019 – by Lana Yoshii
November 13, 2018 5:49 pm
Comments Off on Boston & Cambridge Lodging Market Takes a Positive Turn in Q3 – by Sebastian Colella Following a weak second quarter which featured monthly declines in occupancy and rate declines in both April and May, the Boston & Cambridge lodging market bounced back in the third quarter driven by considerable demand and average daily rate (ADR) in August and September. A solid base of group demand helped to increase compression and drive transient rates during both months, positioning the market to end the year with RevPAR growth over the year prior.
The third quarter resulted in mixed monthly results, but on a year-to-date basis there was a positive change for the market. Q3 occupancy was 91.4%, an increase of 2.9 points from Q3 2017, while ADR increased 1.1%. The third quarter’s RevPAR increased 2.1% over last year. These three months offered 39 compression nights, dates with an occupancy of 95% or higher, a considerable increase from the 27 achieved in Q3 2017.
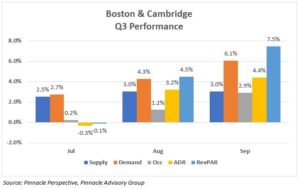
July of 2017 benefitted from a favorable convention calendar which was not the case in 2018. With an 11% decline in group demand, operators dropped transient rates in order to maintain occupancy levels. Without much growth in transient rates, the market ADR declined 0.3%, negatively impacting the month’s RevPAR. Despite the declines in occupancy, July had 15 compression nights, three more than last year.
Largely driving the increases to demand in August, group increased 10%. According to the Massachusetts Convention Center Authority (MCCA), the BCEC and Hynes convention centers generated over 51,000 roomnights in the month, an increase of over 50% from August 2017. The month included 11 nights of compression, an increase from last year’s six. Rate growth of 3.2% in the month was driven entirely by transient rates which made up the majority of August’s 4.5% RevPAR growth.
September’s 6.1% growth in accommodated roomnights marked the market’s thirtieth consecutive month of demand growth. A high level of compression in the month was created by a 15% increase in group demand, which in turn helped operators drive transient rates over 6%. The month included 13 compression nights, four more than last year, at an ADR of over $330.
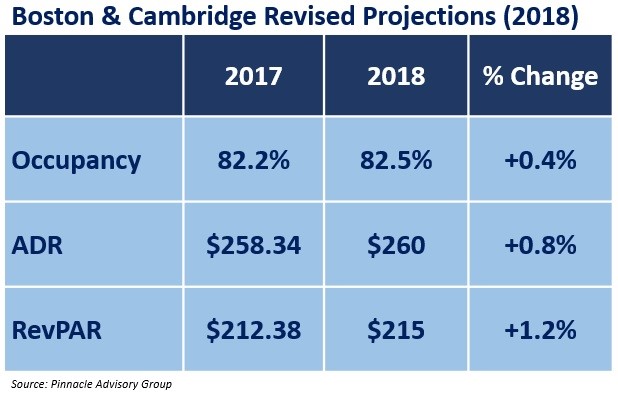
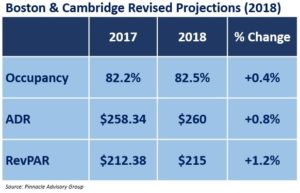
Year-to-date through September, market occupancy has increased 0.5 points and ADR has increased 0.6% compared to the same time period last year. As presented previously, market rate increased 3.2% and 4.4% in August and September, respectively, and similar rate growth is expected for October, a month which featured three citywide events at the Boston Exhibition & Convention Center and the Red Sox playoff run through the World Series. Pinnacle had originally projected the market’s RevPAR to decline 0.5% for calendar year 2018. As a result of the delays in expected hotel openings, above average increases in demand in August and September, combined with the dramatic shift in market rate growth in the third quarter, revised projections indicate a RevPAR growth of 1.2% in 2018.
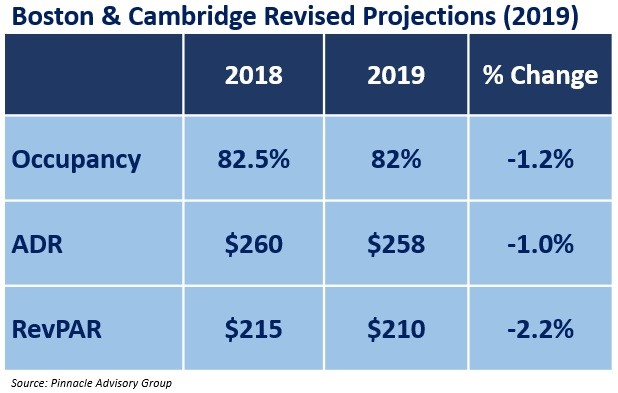
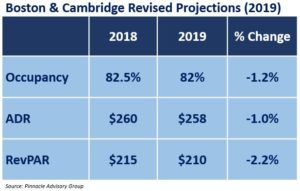
As a result of these positive shifts, Pinnacle has revised projections for 2019. Continued growth in demand of approximately 3.7% is forecasted, however it will not keep pace with supply which is expected to increase over 5%. As a result, occupancy is projected to decline to 82% in 2019 while ADR is projected to decrease 1.0%. Pinnacle is projecting a negative RevPAR in 2019, the first decline since 2016 when the market experienced a similar increase to supply. With the convention calendar indicating a decline of approximately 24% in roomnights (only three months with growth over 2018) and two less citywide events, there will be a lack of base demand to drive rate growth seen in previous years.
Pinnacle Advisory Group’s projections for the Boston and Cambridge lodging market are presented to the Massachusetts Lodging Association annually. The updated presentation can be viewed here.
Sebastian J. Colella is a Vice President with Pinnacle Advisory Group based in the Boston office. With over 15 years in the hospitality industry, Mr. Colella leverages his operational knowledge and expertise from experiences in the field. In the last three years Mr. Colella has completed over 75 hotel consulting and valuation assignments for existing and proposed hotels throughout the country with a primary focus on Boston and its suburbs.
Prior to joining Pinnacle Advisory Group, Mr. Colella held a variety of management roles in hotels, resorts and private clubs. With capacities focusing on both sales and operations, he has worked for ClubCorp, the world leader in private clubs, Rosewood Hotels’ flagship property in New York City, The Carlyle, and lead efforts to open Zanzibar, Tanzania’s first luxury resort, Baraza Resort & Spa. Work with Pinnacle Advisory Group has included market and feasibility analysis, acquisition due diligence, departmental revenue and expense performance evaluations, facility recommendations, brand assessments and impact studies, as well as appraisals of both branded and independent hotels and resorts.
5:45 pm
Comments Off on Revised Outlook 2018-2019, October 2018 – by Rachel Roginsky, ISHC Revised PAG Outlook 2018-19
October 3, 2018 9:10 pm
Comments Off on NYC Group Booking Pace – Sebastian Colella NYC & Company, the official destination marketing organization for New York City, retains Pinnacle Advisory Group to prepare a monthly NYC Group Booking Pace report. In October 2018, Sebastian Colella, a Vice President at Pinnacle, presented a report at NYC & Company’s annual meeting. Pinnacle has been tracking the definite group roomnights for a set of the City’s largest hotels for almost 10 years.
NYC Group Booking Pace 10.3.18 (revised)
September 12, 2018 6:55 pm
Comments Off on Rhode Island Hospitality Economic Outlook – Rachel Roginsky, ISHC Rhode Island Hospitality Presentation FINAL 9’12’18